Networking is easier to understand when you can see it move. These are the tools and the reading list I have built and collected for people learning network engineering — a twelve-module subnetting course, three interactive visualisers, three subnetting tools, a measurement tool, a diagnostic app, and a directory of the free material I would point a junior engineer at first. All of them are free, and everything runs in your browser.
Start here
Directory
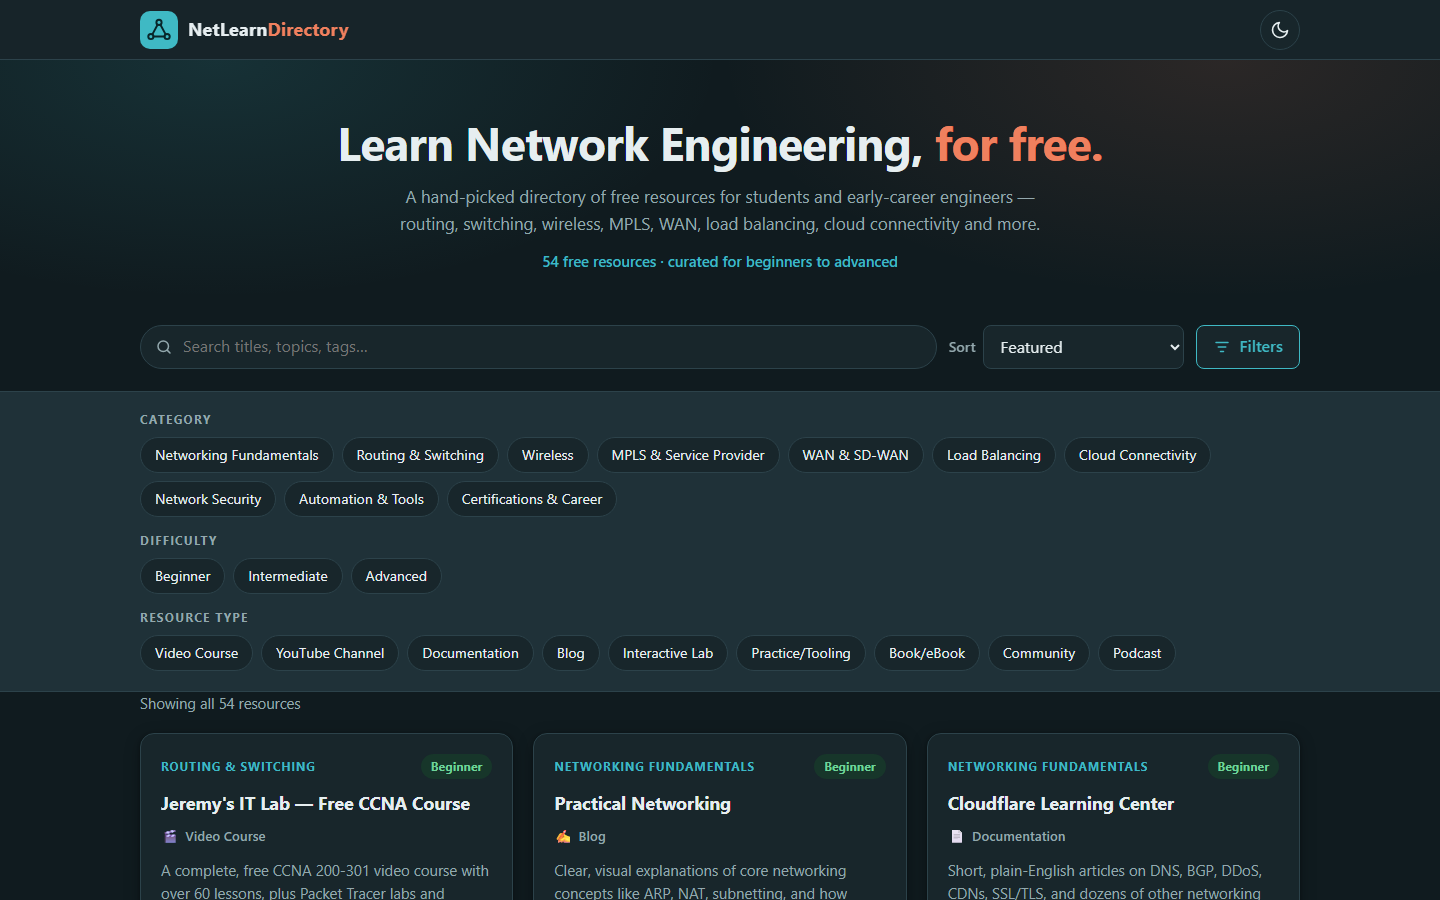
NetLearn Directory
Fifty-four hand-picked free resources for students and early-career engineers, under the banner “Learn Network Engineering, for free.” Everything is searchable and filterable by category, difficulty and format, so you can go straight to a beginner interactive lab or an advanced MPLS deep dive without wading through the rest.
- Ten categories, from fundamentals to cloud connectivity and career
- Beginner, intermediate and advanced difficulty filters
- Video courses, docs, labs, books, podcasts and communities
- Open to contributions — suggest a resource through GitHub
Course · 12 modules
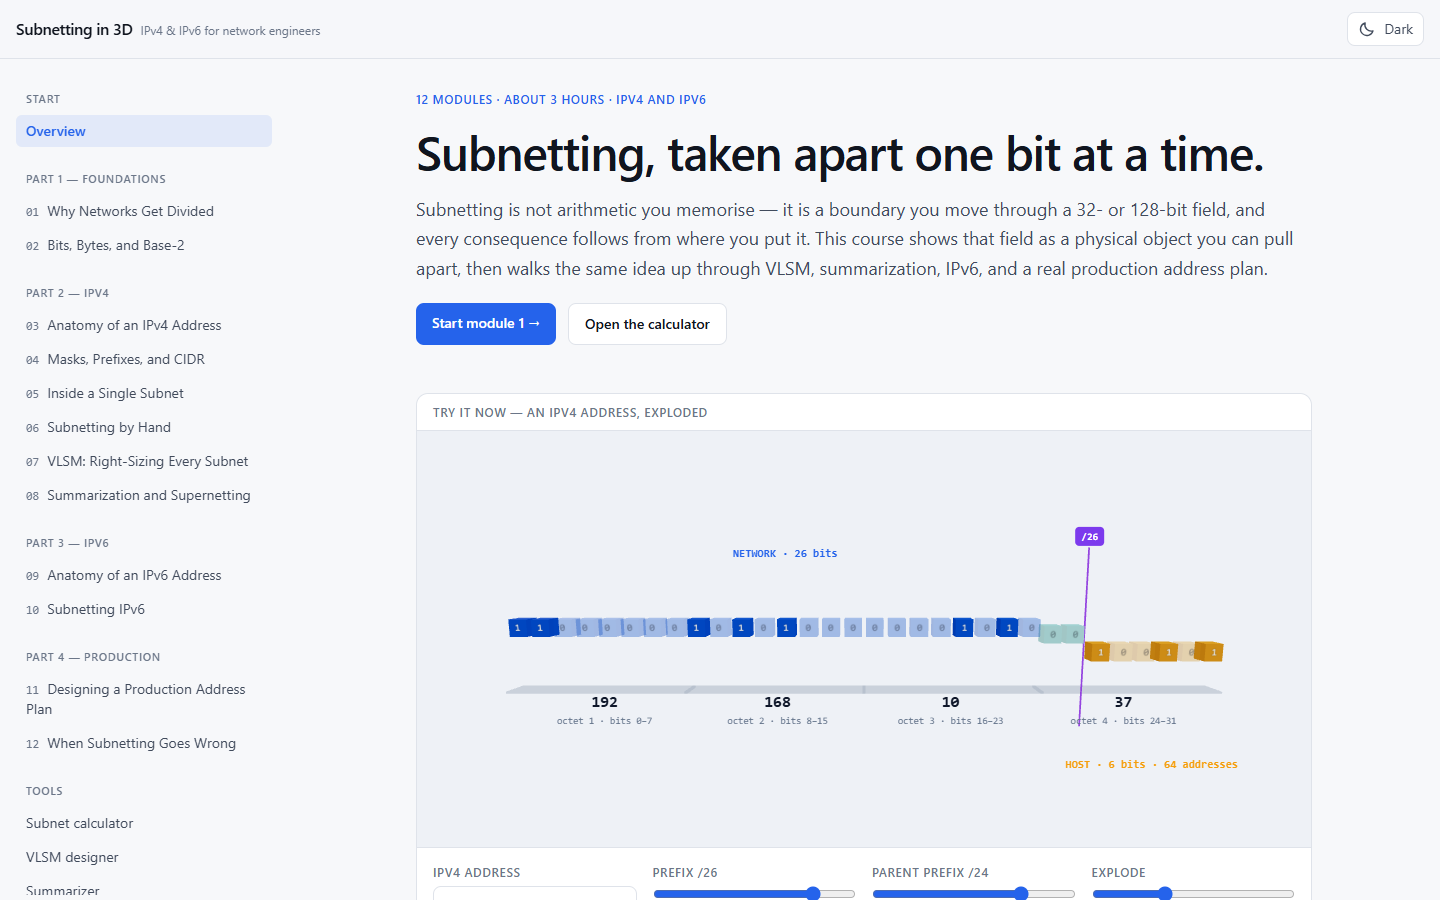
Subnetting in 3D
About three hours across IPv4 and IPv6, built on one idea: subnetting is not arithmetic you memorise, it is a boundary you move through a 32- or 128-bit field, and everything else follows from where you put it. The course draws that field as an object you can pull apart, then carries the same idea up through VLSM, summarization, IPv6 and a production address plan.
- Four parts: foundations, IPv4, IPv6, then production practice
- Every module opens with one 3D figure answering a single question
- Ends on designing a real address plan — and on what goes wrong
- Three companion tools, below, run on the same engines
Interactive · 3D
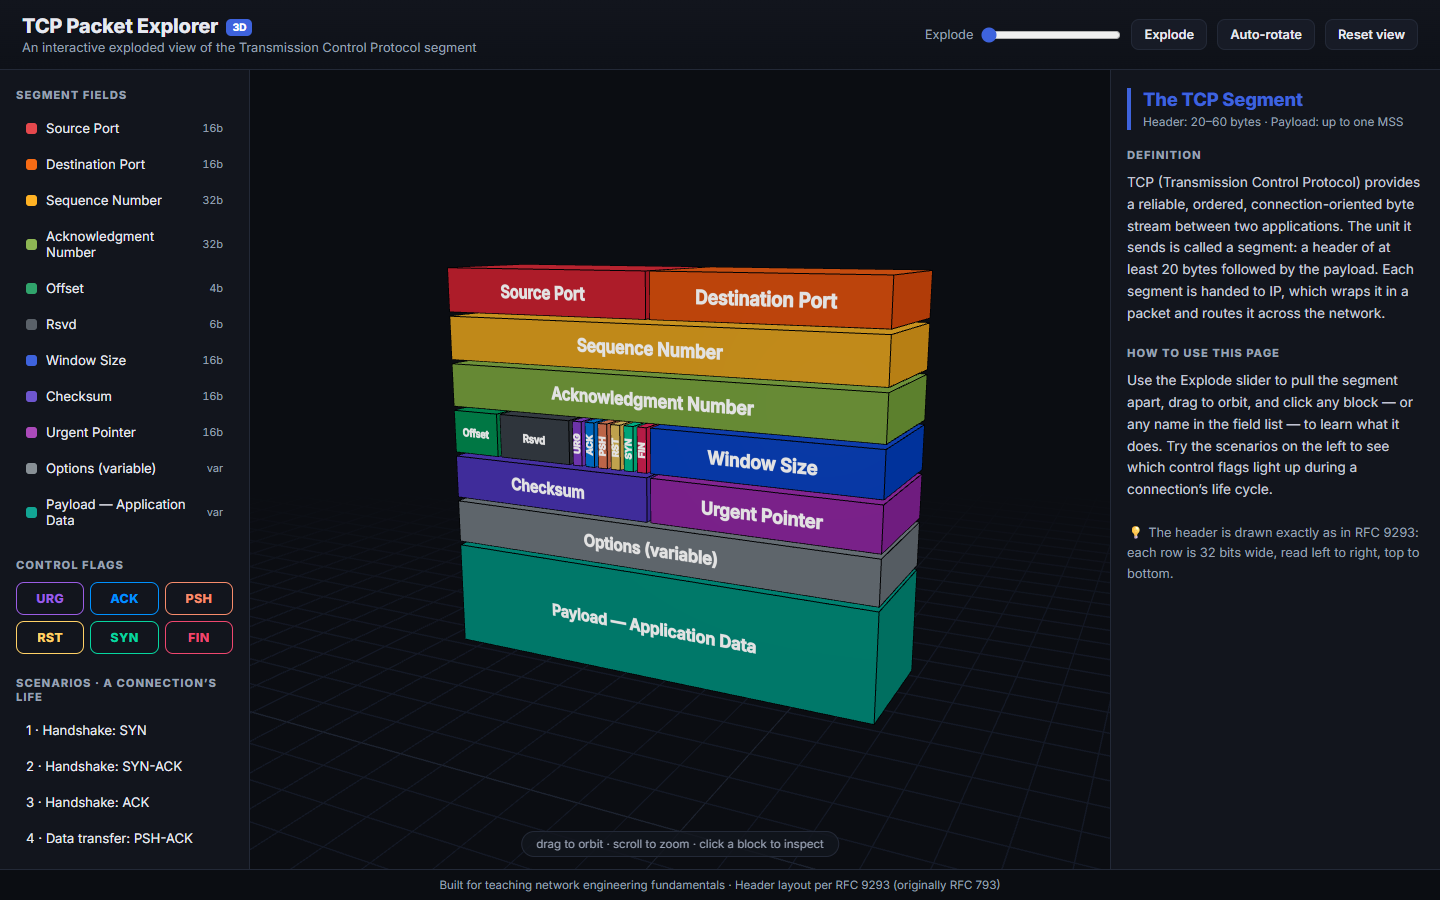
TCP Packet Explorer
A TCP segment pulled apart in three dimensions. Drag the Explode slider and the header separates into its fields; click any block to read what it does. The layout follows RFC 9293 exactly — 32 bits per row, read left to right, top to bottom — so what you learn here matches what you will see in a capture.
- Every header field with its real bit width, from Source Port to Options
- The six control flags: URG, ACK, PSH, RST, SYN, FIN
- Scenarios that walk a connection’s life, handshake through teardown
Interactive · 3D
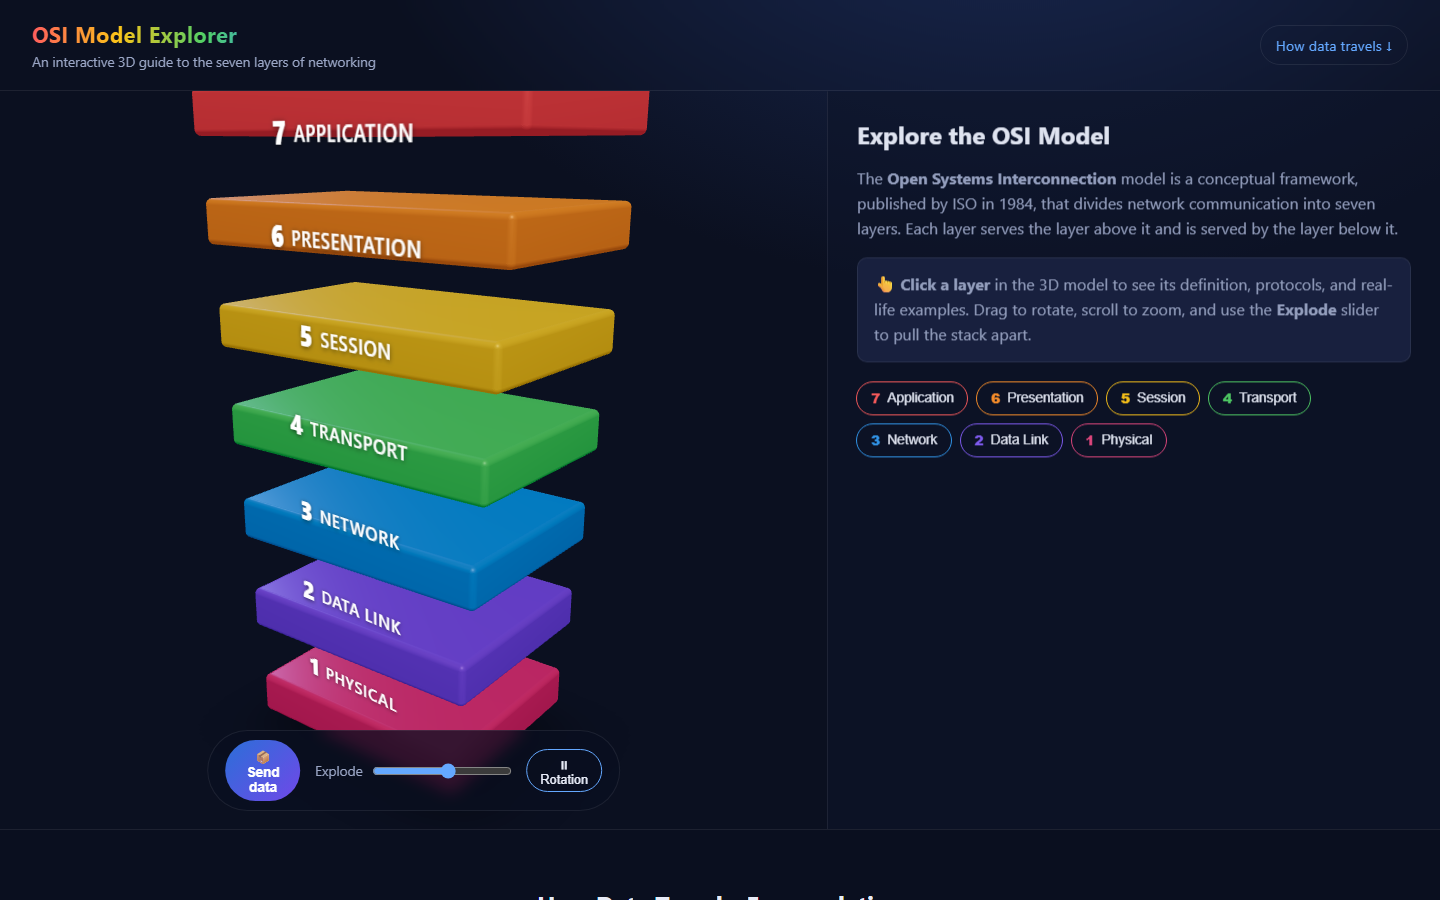
OSI Model Explorer
The seven layers as a stack you can actually take apart. Click a layer for its definition, its protocols and a real-life example; press Send data to watch a message travel down the stack, across, and back up — which is the moment encapsulation usually stops being an abstract word.
- All seven layers, Physical through Application
- Explode slider, free rotation and click-to-inspect
- An animated walk-through of how data actually travels
Tool · Measurement
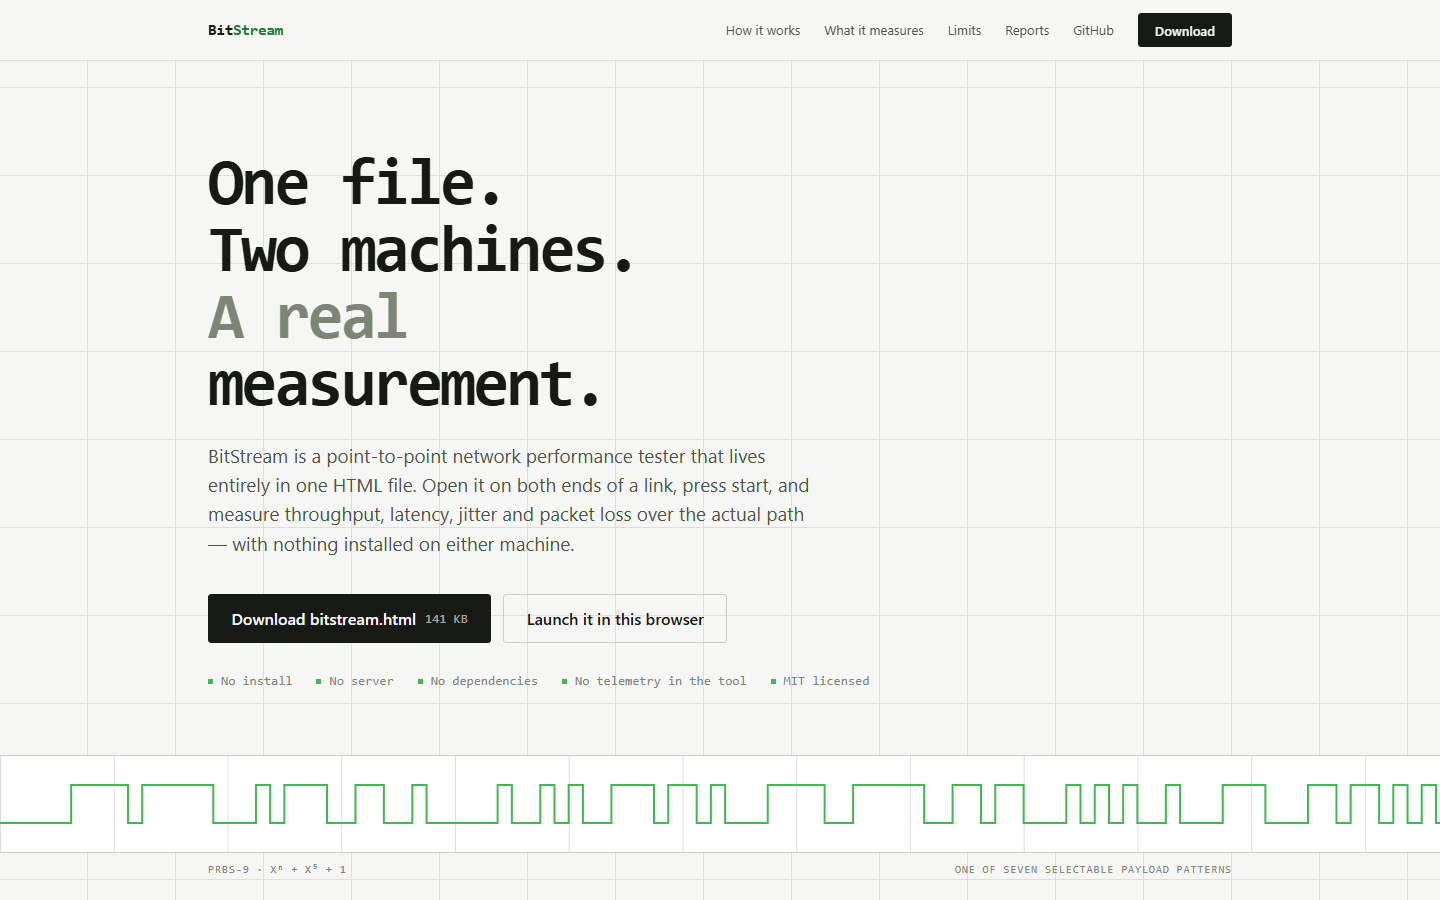
BitStream
“One file. Two machines. A real measurement.” A point-to-point performance tester that
lives entirely in a single 141 KB HTML file. Open it at both ends of a link, exchange a
session code, and measure the actual path — no install, no server, no dependencies, and no
telemetry. It works offline straight from file://.
- Throughput, latency percentiles, RFC 3550 jitter, loss, reordering and duplication
- WebRTC data channels — SCTP over DTLS over UDP
- Seven selectable payload patterns, including PRBS, with integrity checking
- Exports a plain Markdown report with a timestamped event log
Tool · Diagnostics
Advanced MTR
A modern take on the classic mtr for Windows 11. Traceroute and ping in one live
view: every hop between you and a destination is probed continuously, so you can see
exactly where packets are being delayed or lost rather than just that they are.
- Per-hop loss, RTT (last / avg / best / worst), standard deviation and jitter
- Lossy hops auto-tinted amber or red, with live latency sparklines
- Graphical path view labelled by reverse DNS, GeoIP and network owner
- Tray alerts on a loss threshold; exports CSV, TXT or Markdown
- No Administrator rights needed — it uses the Windows IP Helper API
Subnetting tools
The three calculators that ship with the course, pulled out for real work rather than teaching. Each one is wired to the same 3D model as the lessons, so the answer and the reason for the answer arrive together. Nothing is uploaded — every calculation runs in your browser.
Tool · IPv4 and IPv6
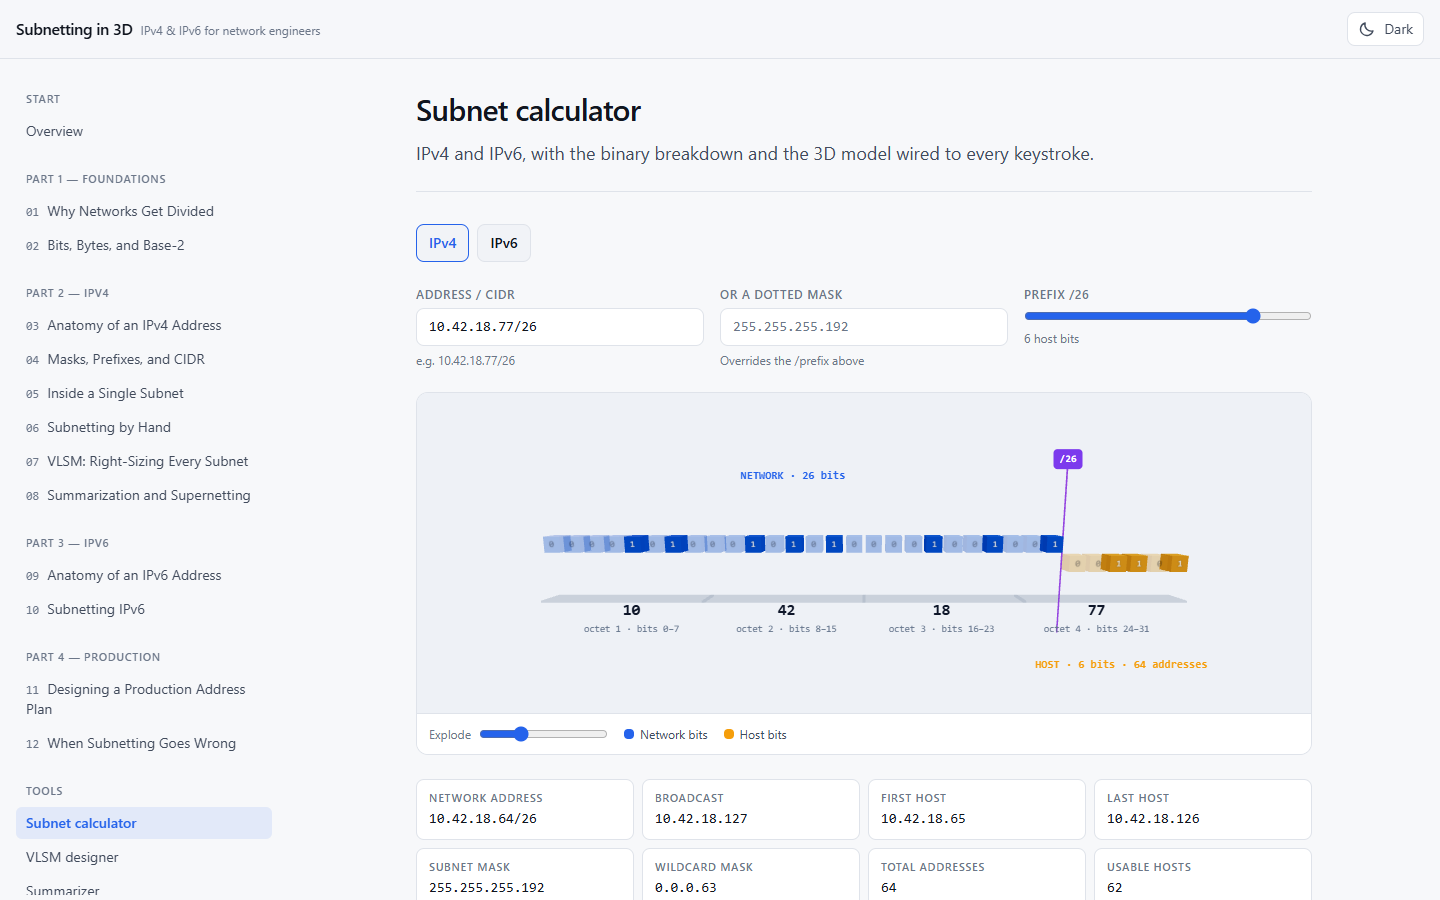
Subnet Calculator
Type an address and prefix — or override it with a dotted mask — and the whole picture updates on every keystroke, including the 3D model of the address itself. Network and broadcast, first and last host, wildcard mask in ACL and OSPF form, total against usable.
- Address, mask and network in binary, plus integer and hexadecimal
- Legacy class, reserved range (RFC 1918) and reverse DNS zone
- Block increment — the fastest way to spot a misaligned allocation
- Full IPv6 mode alongside IPv4
Tool · Address planning
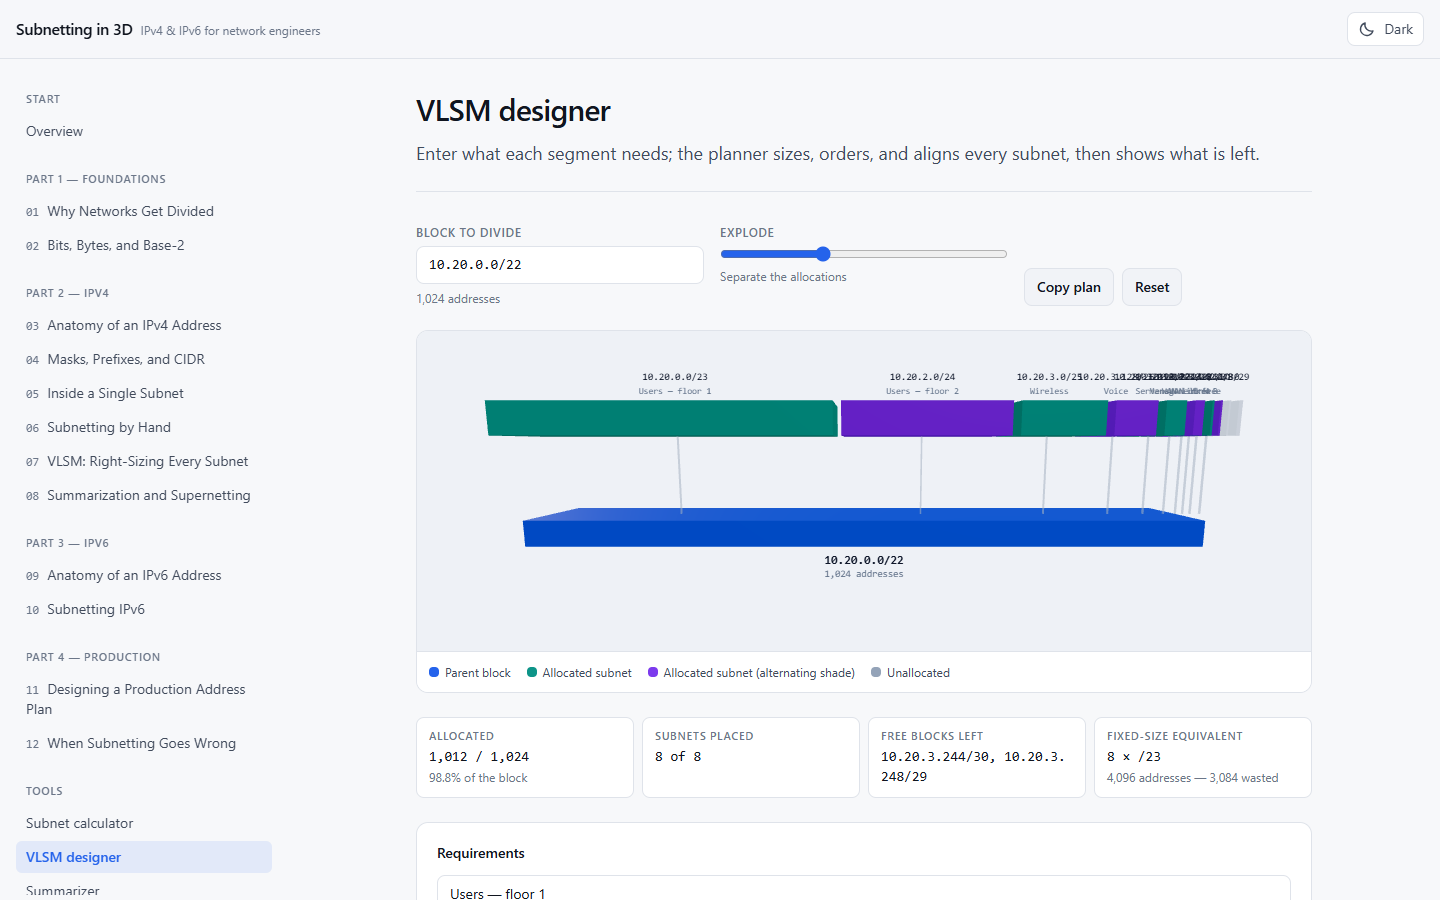
VLSM Designer
Give it a block and a list of what each segment needs; it sizes, orders and aligns every subnet, then shows what is left. It allocates largest first, which is the whole trick — a /26 can only begin on a multiple of 64, so handing out a /30 at offset zero strands everything in between.
- Full plan table: subnet, mask, usable range, broadcast and spare per segment
- Utilisation, subnets placed, and the exact free blocks remaining
- Compares against the fixed-size equivalent, so the waste is a number
- Copy the finished plan out in one click
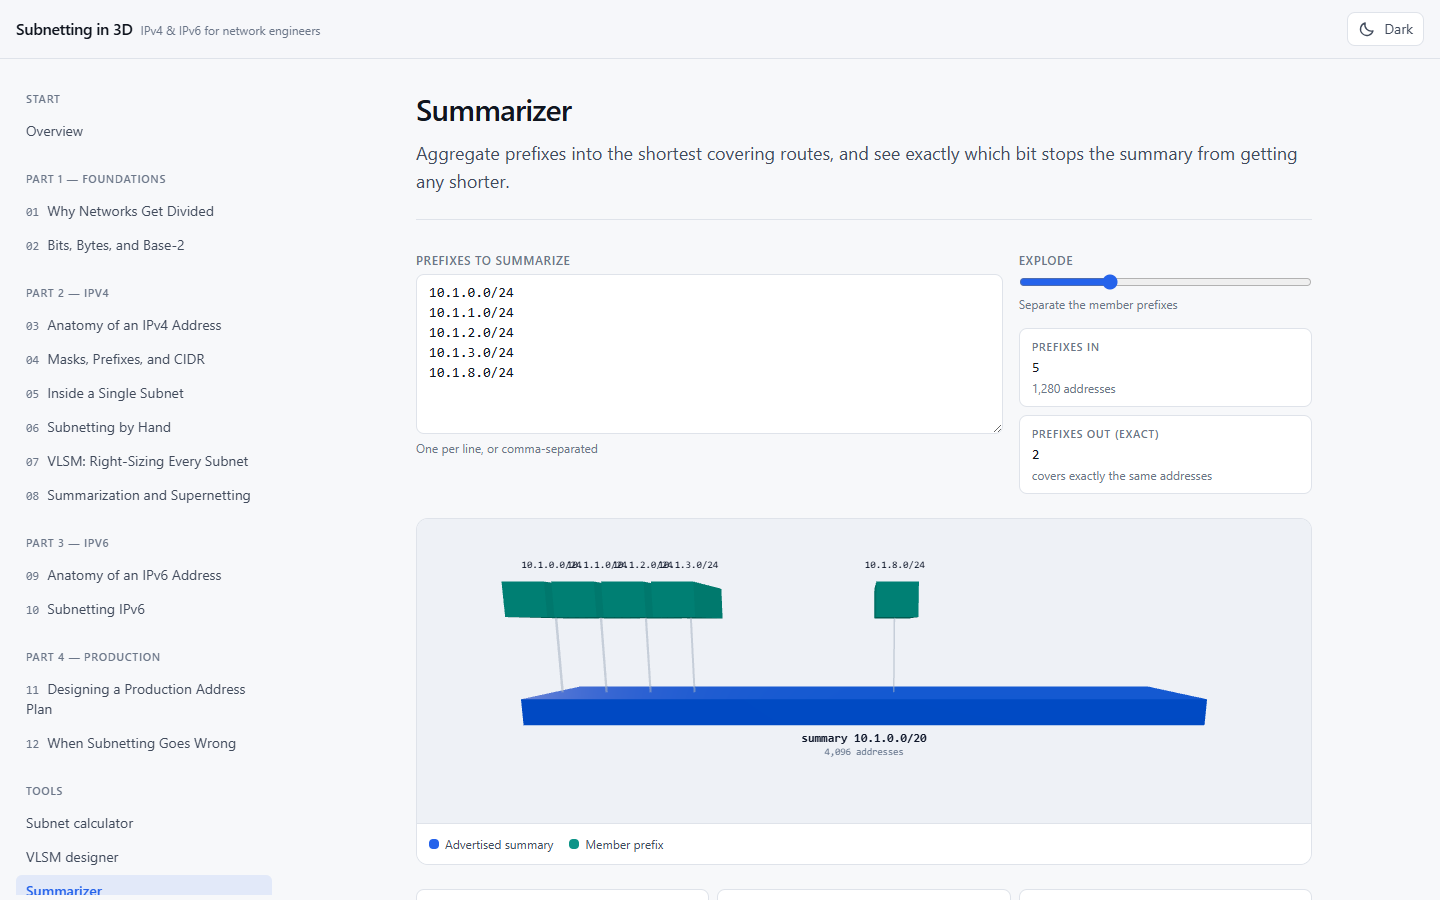
Tool · Route aggregation
Network Summarizer
Paste in a list of prefixes and it aggregates them into the shortest covering routes, then shows exactly which bit stops the summary getting any shorter: the shared leading bits, and the first position where two inputs disagree. That is the moment it becomes obvious why non-contiguous allocations cannot be summarized tightly.
- The single summary route you would type into a router, plus the exact aggregation
- Flags over-advertising — addresses the summary claims that you never allocated
- Bit-level table showing where the addresses stop agreeing
- Makes the cost of a scattered plan visible: same addresses, four routes instead of one
A suggested order
If you are starting from nothing, work down this list rather than across the cards above. Each step assumes the one before it.
- Get the mental model. Open the OSI Model Explorer and send data down the stack until encapsulation feels obvious.
- Look inside one packet. Take a TCP segment apart in the Packet Explorer and follow the handshake scenarios.
- Learn the fundamentals properly. Filter the directory to Beginner and pick a video course or an interactive lab.
- Get subnetting into your hands. Work through Subnetting in 3D, checking yourself against the subnet calculator as you go. Do not skip module 4 — most subnetting mistakes in production trace back to a shaky grasp of what the mask actually does.
- Plan real address space. Size a network with the VLSM designer, then run your prefixes through the summarizer to see whether the plan you just made will actually aggregate.
- Measure a real link. Run BitStream between two machines and read the numbers you have just learned the names of.
- Find out where it hurts. When something is slow, use Advanced MTR to see which hop is responsible.
Suggest a resource
The directory is meant to keep growing. If something free helped you learn this material and it is not listed, open an issue or a pull request on the directory repository, or email me.